|
|
 
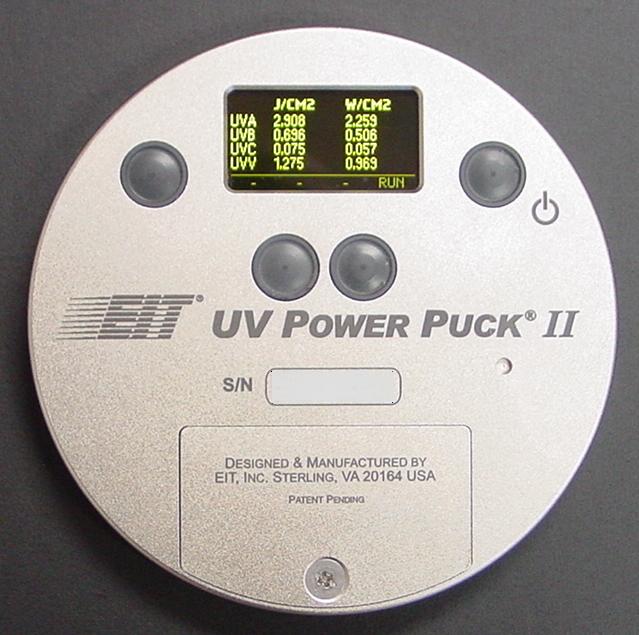
UVICURE PLUSS II & UV POWER PUCK II

Features (Benefits) :-
- Measures UV Peak irradiance (microW/cm2, mW/cm2, W/cm2) and total energy density (microJ/cm2, mJ/cm2, J/cm2) of one spectral bandwidth (Uvicure Plus II) or 4 different bandwidths simultaneously (UV Power Puck II)
- New graph, data, and reference modes to provide choices in how to view the collected data
- Compact Size: 4.6" Diameter (117mm) x 0.5"H (13mm)
- Self-contained - battery-powered (user-replaceable AAA batteries)
- Unit communicates via cable to your PC
|
Application :-
- Curing applications of inks, adhesives, solder masks, and epoxies (not for use in web press applications)
- Measure lamp performance
- Compares the efficiencies of different UV curing systems
- Compare any current reading to chosen baseline reference to compare your system over time
- Establish UV level for proper curing
|
Standard Features and Benefits Include:
Easy to Use. One-Button Operation for On/Off and Run 
Easy to Read Data Display of All 4 Bands.
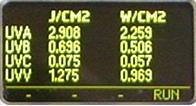
Data collected for all 4 bands on the UV Power Puck II is displayed simultaneously on screen in mW/cm2 and mJ/cm2 for quick and easy viewing by the operator. No need to toggle through all eight readings, one screen at a time. Soft buttons are used for function selections, and are indicated on the bottom of the display for easy operator selection and use.
Standard EIT Multiple Bandwidths:
UVA (320-390nm), UVB (280-320nm), UVC (250-260nm), UVV (395-445nm)
Dynamic Range
Standard unit - 10 Watt; UVA, UVB, UVV; 1 Watt UVC. Low Power unit -100 mW
Setup Function
Provides user selectable instrument default modes for data analysis and comparison, screen, and operational settings.

Reference Mode
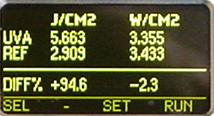
Used for comparison between readings. Can be useful for system setup and troubleshooting. The user can store the selected UV reading in the radiometer as a base line or reference reading, then compare that reading to another. The radiometer will display both readings and indicate the percentage of change between readings. Data is displayed in mJ/cm2 and mW/cm2, and percentage.

Graph Mode
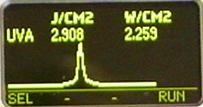
A graph illustrating the collected UV irradiance and energy is displayed for each of the UV bands. Data is expressed in mW/cm2 vs. time. Graphs at right illustrate both a one and two-lamp system.
User Selectable Sample Rate
Smooth On Data: Compatible with previous Power Puck versions.
Smooth Off Data: Compatible with UV PowerMAP at over 2000 samples per second.

Unit of Measure
The unit of measure is user selectable to provide ease of reading for operators. Display the data as you want to see it. Selections are: mJ/cm2, mW/cm2, J/cm2, W/cm2, £gJ/cm2, £gW/cm2
Colorful, Easy to Read Display
Select low, medium, or high intensity for the graphical display.
Communications Port
Serial communication protocol between unit and PC/PDA. Download collected data to a computer for statistical analysis and data logging, and process verification.
|
|

